

Reducing overhead of npm run
Introduction
This year we've had a lot of discussions about overhead of npm run and alternatives like bun run
and recently released node --run introduced by @anonrig.
We also had good posts about this topic, like this one by Marvin Hagemeister Speeding up the JavaScript ecosystem - npm scripts,
which showed some optimization opportunities I used to improve npm run overhead.
All of these discussions motivated me to investigate the overhead of npm run and see if I could reduce it, and here's what I found.
Baseline
First, let's create a simple script to measure the overhead of npm run:
{"scripts": {"echo": "echo 1"}}
When I started working on this, the npm version was 10.5.1, if we try run this command with hyperfine, we will get the following result:
$ hyperfine --warmup 3 "npm run echo"Benchmark 1: npm run echoTime (mean ± σ): 117.1 ms ± 2.7 ms [User: 108.5 ms, System: 31.5 ms]Range (min … max): 113.4 ms … 128.0 ms 25 runs
If you use asdf the overhead will be higher because of the
shim approach, I recommend you to use nvm.
Measuring the overhead
To start measuring the overhead, I used the flag --cpu-prof and got the following graph representing the first 60ms of executing the npm run echo command:
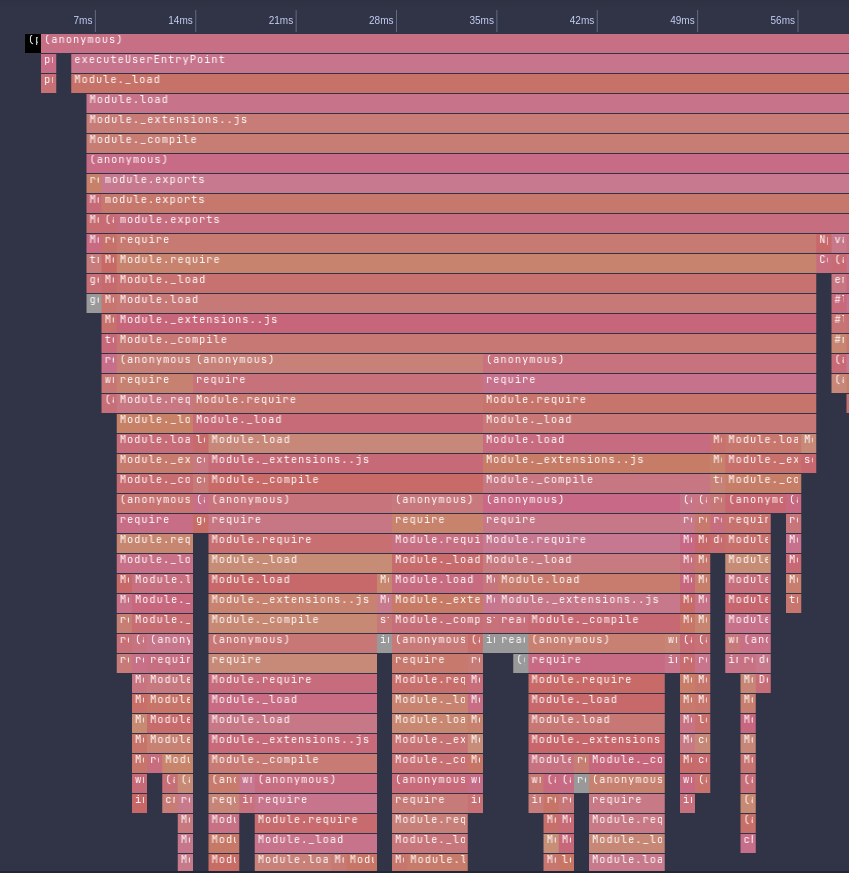
The chart was generated using
vscode, just open the.cpuprofilefile, and click in theshow flame graphicon on top-right.
The Module._load functions represent the cjs loader of Node.js, this means we are spending a lot of time loading cjs modules.
But just in this graph, we can't see what is being loaded, so since I am familiar with the Node.js codebase, why not emit some trace data in the Module._load function to see what is being loaded?
Improving the tooling
My initial attempt to generate some tracing data for Module._load gave me the following result:
MODULE 1484165: TIMING [...shortened.../node_modules/make-fetch-happen/lib/cache/index.js] [./entry.js]: 44.579735 msMODULE 1484165: TIMING [...shortened.../node_modules/make-fetch-happen/lib/fetch.js] [./cache/index.js]: 45.353002000000004 msMODULE 1484165: TIMING [...shortened.../node_modules/make-fetch-happen/lib/index.js] [./fetch.js]: 48.313565999999994 msMODULE 1484165: TIMING [...shortened.../node_modules/npm-registry-fetch/lib/index.js] [make-fetch-happen]: 49.179769 msMODULE 1484165: TIMING [...shortened.../lib/utils/replace-info.js] [npm-registry-fetch]: 66.43049099999999 msMODULE 1484165: TIMING [...shortened.../lib/utils/error-message.js] [./replace-info.js]: 66.59006400000001 msMODULE 1484165: TIMING [...shortened.../lib/utils/exit-handler.js] [./error-message.js]: 77.62554 msMODULE 1484165: TIMING [...shortened.../lib/cli-entry.js] [./utils/exit-handler.js]: 89.835263 msMODULE 1484165: TIMING [] [...shortened.../bin/npm-cli.js]: 122.78886299999999 ms
This was so helpful that I opened a PR on Node.js to land this as a feature:
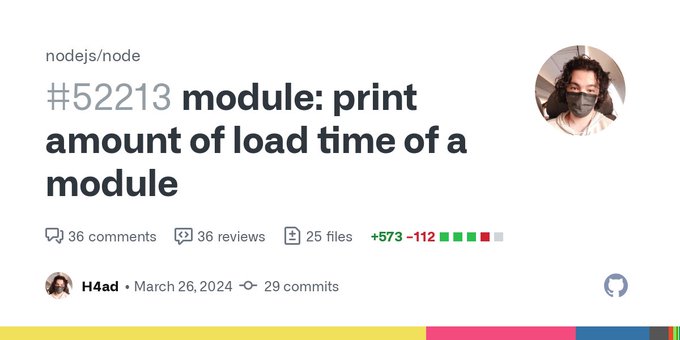
With help of Joyee Cheung, we improved this feature to emit trace_events, that produces a JSON file that can be visualized in chrome://tracing.
This PR was landed on v22.3.0, and you can use it with the following command:
$ node --trace-event-categories node.module_timer --trace-event-file-pattern 'trace-events.log' your-script.js
Then import the trace-events.log file into chrome://tracing and you will get a graph like this:
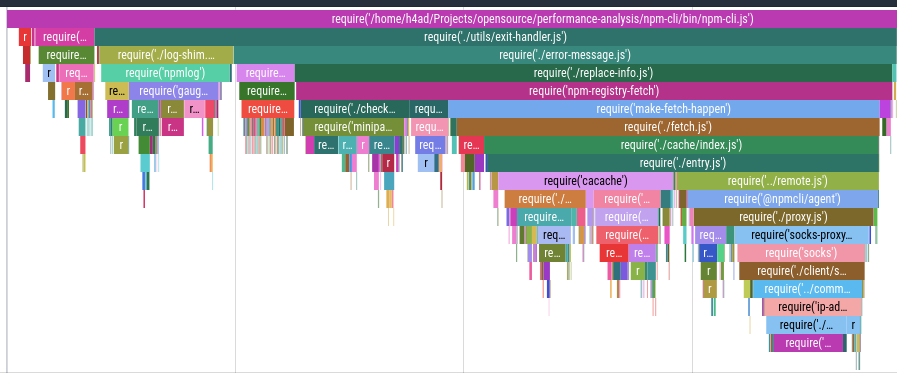
Now we have everything we need to start optimizing the npm run.
Lazy-loading dependencies
All the dependencies of npm are loaded for a reason, and we can't just remove them, but we can try to load them lazily.
To lazy load a dependency on commonjs is very simple, let's use the following image as example:
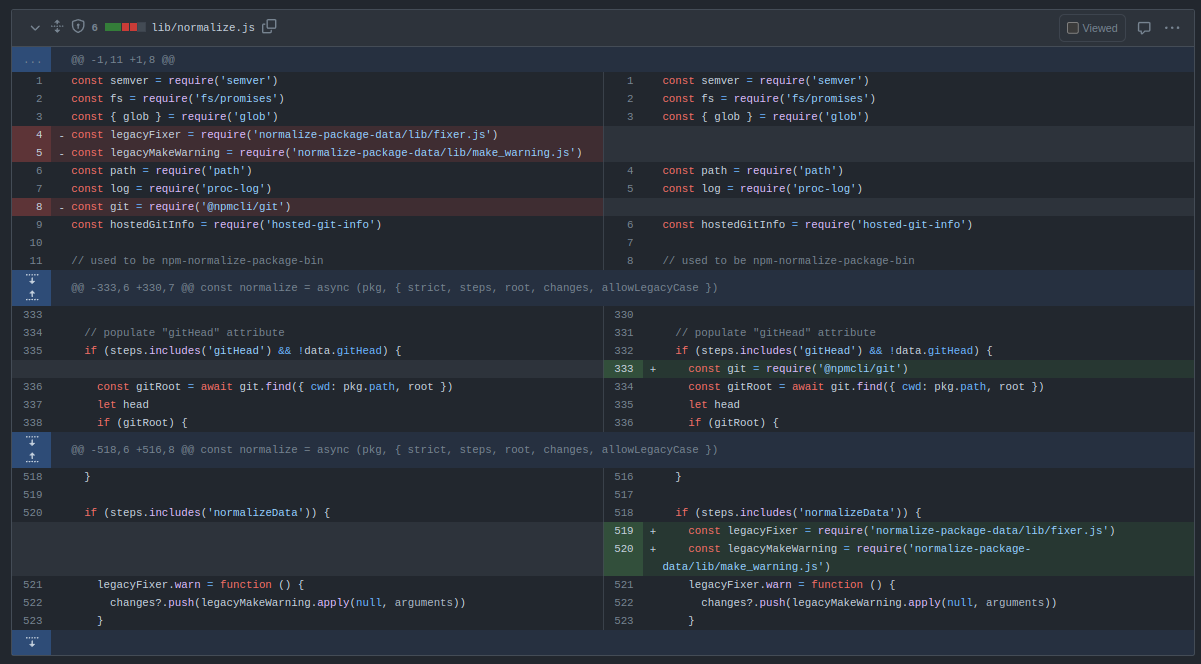
In the image, we moved the require of the dependency we want to lazy-load from the top of the script to be called only when needed.
Using this pattern, I started looking for all dependencies, one by one, that could be lazy-loaded, and I got the following PRs:
npm/cliperf: avoid importing npm-registry-fetch for replace-info- This one was superseded by this PR.
npm/package-jsonfix(perf): lazy load un-common dependencies for npm runnpm/clifix(perf): avoid importing the entire semver package for update-notifiernpm/clifix: lazy load validate npm package name on error messagenpm/package-jsonperf: only import necessary functions from semverbuiltinsperf: only import used function from semvernpm/clifix(perf): lazy load workspace dependencynpm/clifix(perf): only import what is needed for type-defsnpm/clifix(perf): only initialize workpaces when we are inside a workspacenpm/package-jsonfix(perf): lazy load glob on normalize.jsnpm/package-jsonfix(perf): lazy load hosted git info on normalize
Results
All these PRs was released on [email protected], and if we run the same benchmark again, we will get the following result:
$ hyperfine --warmup 3 "npm run echo"Benchmark 1: npm run echoTime (mean ± σ): 87.9 ms ± 1.3 ms [User: 77.0 ms, System: 23.9 ms]Range (min … max): 86.3 ms … 92.3 ms 33 runs
Also, after a huge refactor on terminal display functionalities by Luke Karrys on this PR, on [email protected] we got another improvement:
$ hyperfine --warmup 3 "npm run echo"Benchmark 1: npm run echoTime (mean ± σ): 79.6 ms ± 0.8 ms [User: 71.3 ms, System: 19.5 ms]Range (min … max): 78.2 ms … 81.8 ms 37 runs
In total, we went from 117ms to 80ms, which represents a 46% improvement in npm run overhead.
What about the alternatives?
In case you are wondering, what if we compare it to other tools like bun run and node --run or pnpm, well, here is the result:
$ hyperfine --warmup 3 "npm run echo" "node --run echo" "pnpm run echo" "bun run echo"Benchmark 1: npm run echoTime (mean ± σ): 81.8 ms ± 1.1 ms [User: 70.6 ms, System: 20.1 ms]Range (min … max): 80.3 ms … 84.8 ms 36 runsBenchmark 2: node --run echoTime (mean ± σ): 4.2 ms ± 0.4 ms [User: 2.0 ms, System: 2.3 ms]Range (min … max): 3.5 ms … 5.6 ms 568 runsWarning: Command took less than 5 ms to complete. Results might be inaccurate.Benchmark 3: pnpm run echoTime (mean ± σ): 285.2 ms ± 3.2 ms [User: 254.3 ms, System: 48.4 ms]Range (min … max): 281.4 ms … 290.5 ms 10 runsBenchmark 4: bun run echoTime (mean ± σ): 5.4 ms ± 0.4 ms [User: 2.0 ms, System: 3.5 ms]Range (min … max): 4.7 ms … 6.9 ms 424 runsWarning: Command took less than 5 ms to complete. Results might be inaccurate.Summary'node --run echo' ran1.31 ± 0.15 times faster than 'bun run echo'19.67 ± 1.71 times faster than 'npm run echo'68.56 ± 5.93 times faster than 'pnpm run echo'
For this latest command, I used npm v10.8.1, bun v1.1.17, node v22.3.0 and pnpm v9.4.0
Conclusion
I want to thank the NPM team, especially Luke Karrys and @wraithgar for helping me get all these PRs.
Optimizing NPM is not an easy task as the world (and many versions of Node.js) depend on it, and even small mistakes or premature optimizations can break the world, so I have huge respect for the NPM team for doing this work.
Also, not all improvements should be merged, and that's okay. We need to be careful with the trade-offs we are making, my optimizations were focused on making as few changes as possible while keeping the codebase maintainable and readable. Sometimes saving 5ms isn't worth the added complexity to the codebase, I had a good example of that in this PR.
There is a huge ocean of improvements that can be made to the JS ecosystem that are waiting to be explored, and I hope this post can inspire and also give some tips on how to start exploring this ocean.